Watching It: Golden Signals, a Region Quirk, and Logs on a Timer
The first post in this series was about picking a CI/CD tool.
The second was about what got built. Both were really about one
question: can a commit landing on main be trusted to ship correctly, automatically, without anyone
watching? Once the answer was yes, a different question showed up right behind it: once it has shipped, how
would anyone know if the thing it shipped was actually working?
That’s monitoring, alerting, and logging, and on a project with a real dollar ceiling, it turns out to raise the exact same questions the pipeline did: what’s free, what needs a region nobody would guess, and what’s worth paying to keep around versus letting expire.
Golden signals on a site with no servers
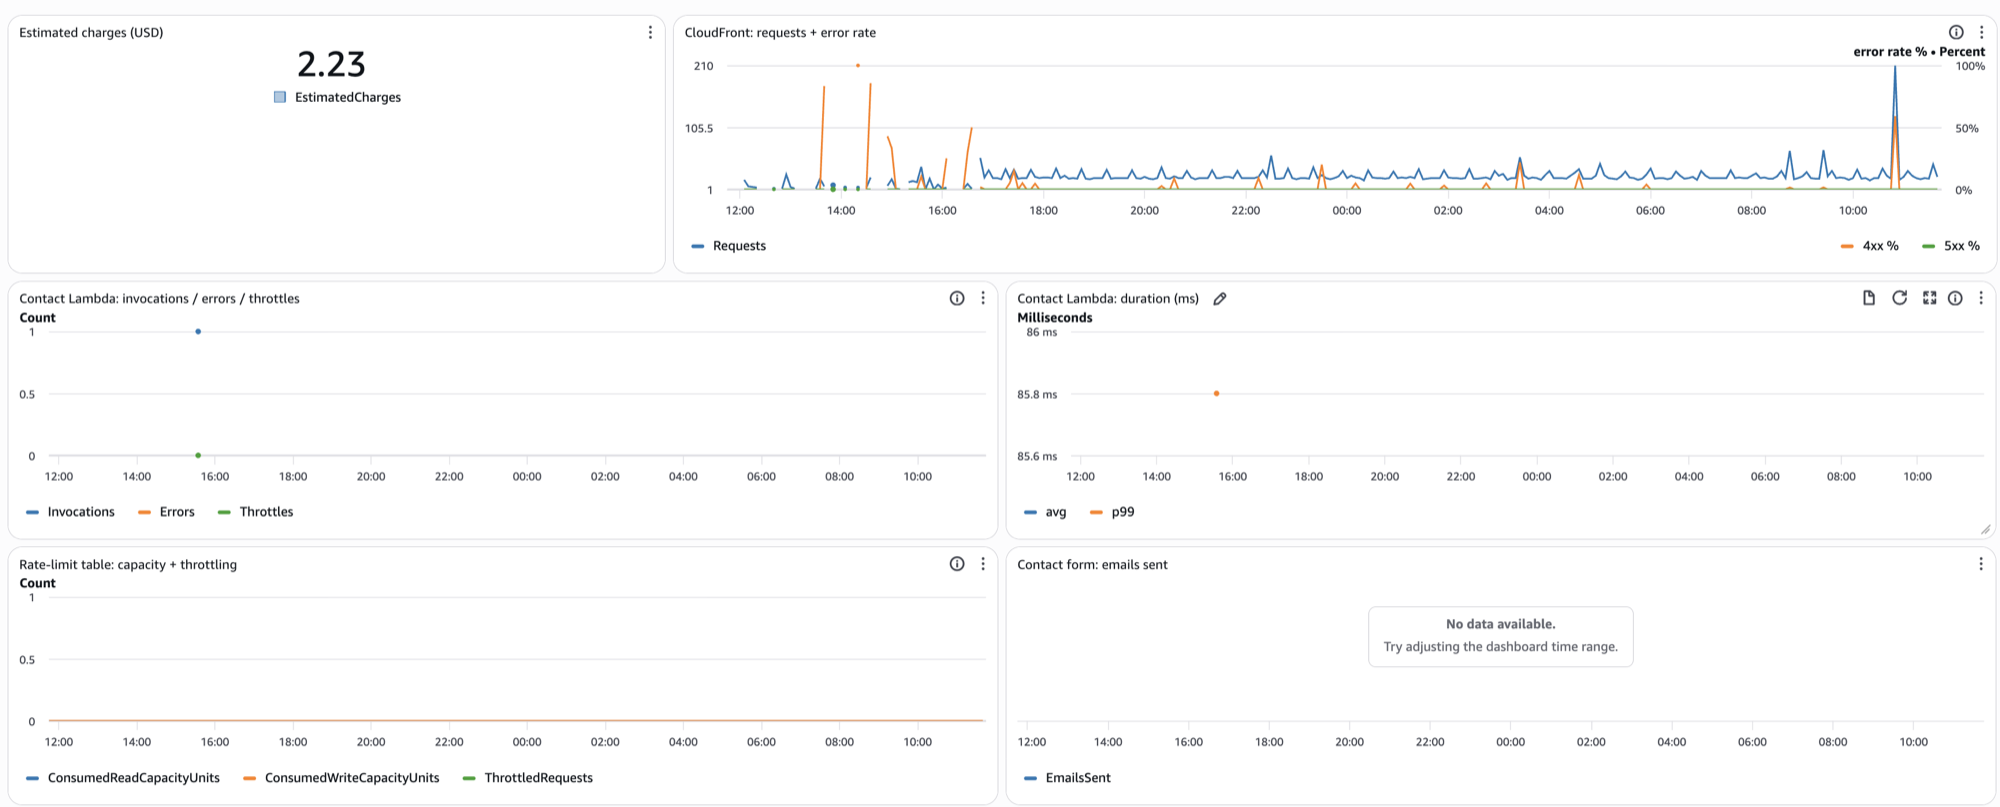
The classic four (traffic, errors, latency, saturation) assume something is usually true here: a request hits a process you can instrument. A static site behind a CDN doesn’t have that process for most of what it serves. Mapping the four onto this stack means being honest about which ones are free and which one has a real gap:
- Traffic: CloudFront’s
Requestsmetric. Free, standard, no configuration needed. - Errors: CloudFront’s
4xxErrorRate/5xxErrorRate. Also free and standard. - Saturation: Lambda concurrency and DynamoDB throttled-request counts, for the one dynamic piece (the contact form) this site has.
- Latency: this is the honest gap. CloudFront’s actual origin-latency metric sits behind an “additional metrics” opt-in that costs extra per distribution, and enabling it just to complete a checklist isn’t a good trade for a personal site with negligible traffic. What’s tracked instead is contact-Lambda duration: real latency data, just for a small dynamic slice of the site rather than the static majority of it. (A free external uptime check, below, later added the better signal: end-to-end response time from outside AWS.)
That last point is worth sitting with: a monitoring setup that quietly enables a paid metric so the dashboard looks complete is a worse decision than one that ships three-and-a-half golden signals and says so.
The practice that matters more than the metrics
Two alarms watch the contact Lambda for two different reasons, and conflating them would be the actual mistake: one fires on volume (more sends than a real visitor would plausibly generate; abuse, not a bug), the other fires on errors (the function actually throwing; a bug, not abuse, and it doesn’t care how many times it happened: three in five minutes is already a broken deploy). Same resource, same notification channel, deliberately different triggers, because “something’s unusual” and “something’s broken” call for different responses and merging them into one alarm would just mean learning to ignore whichever one cries wolf first.
The first version of the CloudFront error alarm is the cautionary tale here. It watched total error rate
(4xx plus 5xx, over 5%, two periods in a row) and flapped between ALARM and OK four times in a single afternoon
while the site was perfectly healthy. The metrics and access logs settled it quickly: 5xx was 0% all day, and
every “error” was a 404 from internet background noise: WordPress and .env scanners, a bot POSTing to the
raw CloudFront address, browsers asking for a favicon, crawlers asking for a robots file. On a site that sees a
handful of requests per five minutes, two or three of those is 50%. The fix was two separate ideas: alarm on
the failure that actually means the site is broken (5xx, not 4xx, since a client asking for a page that doesn’t
exist isn’t an outage), and use metric math to ignore any window with too little traffic for a percentage to
mean anything. An alarm that fires on healthy traffic doesn’t just waste an email; it teaches you to ignore the
one that’s real. The whole fix is a metric-math expression on the alarm:
resource "aws_cloudwatch_metric_alarm" "cloudfront_error_rate" {
  provider            = aws.us_east_1
  alarm_name          = "romancenko-com-cloudfront-error-rate"
  comparison_operator = "GreaterThanThreshold"
  threshold           = 5
  evaluation_periods  = 2
  treat_missing_data  = "notBreaching"

  metric_query {
    id          = "requests"
    return_data = false
    metric {
      namespace   = "AWS/CloudFront"
      metric_name = "Requests"
      period      = 300
      stat        = "Sum"
      dimensions  = local.cf_dims
    }
  }

  metric_query {
    id          = "errors5xx"
    return_data = false
    metric {
      namespace   = "AWS/CloudFront"
      metric_name = "5xxErrorRate"
      period      = 300
      stat        = "Average"
      dimensions  = local.cf_dims
    }
  }

  metric_query {
    id          = "guarded"
    expression  = "IF(requests >= 10, errors5xx, 0)"   # ignore windows with too little traffic
    return_data = true
  }
}
The other deliberate choice is in what “no data” is allowed to mean. Most of these alarms treat a quiet period
as fine: no CloudFront requests in five minutes doesn’t imply an error rate, no contact-form errors doesn’t
imply anything broken. But the alarm watching estimated AWS spend does not get that same default. If the
one account-level checkbox that makes that metric exist at all hasn’t been flipped yet, the alarm should look
exactly as unconfigured as it actually is, sitting in INSUFFICIENT_DATA, not quietly reading as “all clear.”
Defaulting missing data to “fine” is the right call constantly and the wrong call exactly when the reason data
is missing is that nobody finished setting the thing up.
# most alarms: a quiet period is fine
treat_missing_data = "notBreaching"

# the spend alarm sets nothing here, so the default ("missing") applies:
# until Billing Alerts is switched on it shows INSUFFICIENT_DATA, not OK
Why us-east-1 keeps coming back
Two real deploy failures this round, both the same shape: AWS treats certain metrics and certain alarm mechanics as global in spirit but us-east-1-only in practice, and nothing warns you until the API call actually fails.
The first: CloudWatch flatly rejects an alarm whose notification target lives in a different region than the alarm itself:
Invalid region eu-west-2 specified. Only us-east-1 is supported.Billing metrics and CloudFront metrics both only ever publish to us-east-1, regardless of where the resources they describe actually run, so an alarm watching either one has to live there too, and that alarm’s SNS target has to live there with it. Not a permissions problem, not a typo, just a hard requirement, which is why two alarms in this setup now have their own us-east-1 notification topic instead of reusing the one everything else shares.
provider "aws" {
  alias  = "us_east_1"
  region = "us-east-1"
}

resource "aws_sns_topic" "us_east_1_alerts" {
  provider = aws.us_east_1
  name     = "romancenko-com-us-east-1-alerts"
}

resource "aws_cloudwatch_metric_alarm" "estimated_charges" {
  provider      = aws.us_east_1
  alarm_actions = [aws_sns_topic.us_east_1_alerts.arn]   # same region as the alarm
  # ...
}
The second showed up wiring in CloudFront access logs: the distribution update failed with an access-denied error naming an S3 bucket ACL, even though the deploying identity already had full permissions on that bucket. The real cause wasn’t permissions at all; it was sequencing. CloudFront’s logging setup checks the destination bucket’s ACL synchronously, and the distribution update had started before the ACL resource had actually finished applying, a fraction of a second’s difference that an infrastructure-as-code tool has no way to know matters unless something tells it to wait. That something is one line:
resource "aws_cloudfront_distribution" "this" {
  depends_on = [aws_s3_bucket_acl.logs]   # the ACL must exist before logging_config is applied

  logging_config {
    bucket = aws_s3_bucket.logs.bucket_domain_name
    prefix = "cloudfront/"
  }
  # ...
}
Both are the same underlying lesson: “global” AWS features often have one specific region where their control plane actually lives, and the failure mode when you get it wrong is a clear, specific, quotable error message, which is a better failure mode than the alternative (a silent no-op), but only if you’re prepared to read it closely instead of assuming it’s a red herring.
Watching from the outside
Every alarm above lives inside the thing it watches. If the account, the region, or the domain’s DNS is what broke, they have nothing to say. So one more piece sits deliberately outside AWS: an external uptime check that fetches the index page, and a few others, every minute and expects a plain 200. Site24x7’s free plan covers it (five monitors, one-minute checks, email alerts, no card), and the first reading came back at a few tens of milliseconds from five UK locations, which is the end-to-end latency number the CloudFront metrics above couldn’t give for free.
Two decisions made it fit the rest of the setup:
- Alerts go to an address off the monitored domain. All mail for this domain depends on DNS that Terraform manages and auto-applies. A bad DNS change could take the site and the mailbox down together, and the alert about it would go to the mailbox that’s down. An uptime alert should never depend on the thing being watched.
- It’s config as code, isolated on purpose. The monitors are Terraform too, but in their own root module, with their own state and their own CI job that’s allowed to fail. A provider that can’t authenticate fails the entire plan, and this account started on a 30-day full trial with the free plan’s API access documented nowhere. If that API ever stops working, the worst outcome is one red-but-harmless job. The monitors keep running inside Site24x7 either way, and AWS applies never depend on a third party’s plan tiers.
Automating a brand-new SaaS account turned out to be mostly a study in provider defaults:
- The first apply failed because a fresh account has none of the configuration profiles a monitor needs, and the error only names one missing prerequisite at a time. Rather than fix them one failed apply at a time, a temporary read-only CI job (it already had the credentials) listed what the account actually contained, and the second pass got everything.
- When a profile is left unspecified, the provider takes the first one the API lists, which for locations was Asia Pacific. Right for nobody visiting a UK-hosted site. Defaults in these providers mean “first in the list,” not “sensible,” so anything that matters gets pinned by name.
- The account’s data sits in a UK region, but the provider only knows a hard-coded list of data centers with no UK entry, and an unrecognized value doesn’t error, it silently falls back to the US endpoints. It worked only because the login itself lives on the US side; reading the provider’s source, not its docs, is what showed that.
Logs that expire on purpose
Every log this project writes (CloudFront access logs, the contact Lambda’s function logs, DNS query logs) keeps three days of history and no more. That’s not a placeholder waiting to be tuned up later, it’s the actual right number for what these logs are for: catching something that broke in the last few days, not building an archive nobody will ever open. Storage cost scales with what’s kept, not what’s written, so the retention setting is the cost control, not a separate budget line to watch. In Terraform, that is one shared value used in two places:
locals {
  log_retention_days = 3
}

resource "aws_cloudwatch_log_group" "contact_lambda" {
  name              = "/aws/lambda/romancenko-com-contact"
  retention_in_days = local.log_retention_days
}

resource "aws_s3_bucket_lifecycle_configuration" "logs" {
  bucket = aws_s3_bucket.logs.id
  rule {
    id     = "expire-logs"
    status = "Enabled"
    filter {}
    expiration { days = local.log_retention_days }
  }
}
The one thing deliberately not logged is the site’s own S3 bucket. It only ever receives authenticated requests from CloudFront, so its access logs would describe exactly the same traffic CloudFront’s own logs already describe; paying to store the same information under two different keys isn’t caution, it’s just redundant.
Same instinct as the whole series, applied one layer up: don’t reach for the complete, exhaustive version of a system by default. Reach for the version that answers the actual question (is this working, and if not, why) and be honest in writing about the piece it doesn’t cover yet.
The outside-AWS uptime check gets its own write-up: Uptime Monitoring as Code: Site24x7, Terraform, and Zoho’s OAuth.